Understanding Triangles
Triangles are among the most common chart patterns in technical analysis. They are continuation patterns that indicate a period of consolidation before the price continues in the direction of the previous trend. There are three main types of triangles: ascending, descending, and symmetrical.
Understanding Rising and Descending Triangle Patterns:
Rising and descending triangles are continuation patterns characterized by converging trendlines, indicating a period of consolidation within the market. These patterns typically occur after a sustained price move and signify a temporary pause in the prevailing trend.
Ascending Triangle
Key Features:
- Horizontal Resistance Line: Indicates a level where sellers are consistently stepping in.
- Rising Support Line: Shows that buyers are becoming more aggressive over time.
- A rising triangle pattern forms when the market experiences higher lows but encounters resistance at a horizontal trendline.
- This pattern suggests bullish sentiment, with buyers gaining strength as price consolidates near resistance.
- The breakout from a rising triangle pattern is typically in the direction of the preceding trend, signaling a continuation of the bullish momentum.
.

Trading Strategy:
- Entry Point: Traders typically enter a long position when the price breaks above the horizontal resistance line with strong volume.
- Stop Loss: Place a stop loss below the rising support line to manage risk.
- Target Price: Measure the height of the triangle and project it upwards from the breakout point to estimate the target price.
Descending Triangle
Key Features:
- Horizontal Support Line: Indicates a level where buyers are consistently stepping in.
- Falling Resistance Line: Shows that sellers are becoming more aggressive over time.
- Adescending triangle pattern emerges when the market forms lower highs but finds support at a horizontal trendline.
- Descending triangles often indicate bearish sentiment, with sellers gaining control as price consolidates near support.
- The breakout from a descending triangle pattern tends to occur to the downside, confirming a continuation of the bearish trend.
Trading Strategy:
- Entry Point: Traders typically enter a short position when the price breaks below the horizontal support line with strong volume.
- Stop Loss: Place a stop loss above the falling resistance line to manage risk.
- Target Price: Measure the height of the triangle and project it downwards from the breakout point to estimate the target price.
Symmetrical Triangle
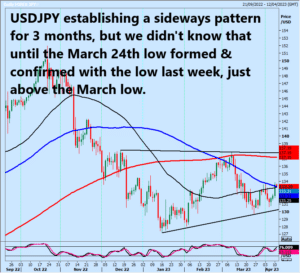
A symmetrical triangle is formed by converging trendlines, with both the resistance and support lines sloping towards each other. This pattern indicates a period of consolidation before a potential breakout in either direction.
Key Features:
- Converging Trendlines: Both the resistance and support lines slope towards each other, indicating a tightening price range.
- Neutral Bias: The pattern does not indicate a specific direction for the breakout.
.

.
Trading Strategy:
- Entry Point: Traders wait for a breakout in either direction with strong volume before entering a position.
- Stop Loss: Place a stop loss below the lower trendline for a long position or above the upper trendline for a short position.
- Target Price: Measure the height of the triangle and project it in the direction of the breakout to estimate the target price.
Understanding Wedges
Wedges are similar to triangles but are typically considered reversal patterns. There are two main types of wedges: rising wedges and falling wedges.
Rising Wedge
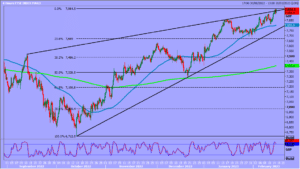
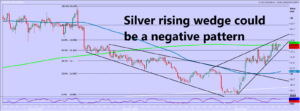
A rising wedge is characterized by upward-sloping support and resistance lines that converge. This pattern suggests a weakening upward trend and potential reversal to the downside.
Key Features:
- Converging Trendlines: Both the support and resistance lines slope upwards, indicating a narrowing price range.
- Bearish Bias: The pattern suggests a potential reversal to the downside.
.

Trading Strategy:
- Entry Point: Traders typically enter a short position when the price breaks below the lower support line with strong volume.
- Stop Loss: Place a stop loss above the upper resistance line to manage risk.
- Target Price: Measure the height of the wedge and project it downwards from the breakout point to estimate the target price.
.

Falling Wedge
A falling wedge is characterized by downward-sloping support and resistance lines that converge. This pattern suggests a weakening downward trend and potential reversal to the upside.
Key Features:
- Converging Trendlines: Both the support and resistance lines slope downwards, indicating a narrowing price range.
- Bullish Bias: The pattern suggests a potential reversal to the upside.
Trading Strategy:
- Entry Point: Traders typically enter a long position when the price breaks above the upper resistance line with strong volume.
- Stop Loss: Place a stop loss below the lower support line to manage risk.
- Target Price: Measure the height of the wedge and project it upwards from the breakout point to estimate the target price.
Volume and Its Role in Confirming Patterns
Volume plays a crucial role in confirming the validity of triangles and wedges. A breakout accompanied by high volume is more likely to be genuine and sustainable.
Key Points:
- Volume Increase: A significant increase in volume during a breakout confirms the strength of the move.
- Volume Decrease: A lack of volume during a breakout may indicate a false breakout or lack of conviction.
Volume Analysis Tips:
- Watch for Volume Spikes: Look for sudden increases in volume during the breakout.
- Compare Volume Levels: Compare current volume levels to historical averages to gauge the significance of the breakout.
By understanding and effectively trading triangles and wedges, traders can enhance their ability to anticipate market movements and execute low-risk trades with higher precision.


